
How many employees quit your organization every year?
You would probably be able to answer this question from the statistics that you gather but may fail to understand, analyze and predict the underlying factors much before the attrition occurs.
Employee attrition is the most common and significant challenge for almost every organizations today. With the rise of the millennial workforce, who will comprise half of the total global workforce by 2020, the trend seems to be highly conspicuous According to a study, one in every 2 millennial will quit their job in 2 years. This is a highly alarming trend as retaining an employee is far less expensive and much easier than replacing them with the new ones. Analytics can be the savior for you here as it will help in predicting the cause as well as the metrics of identifying attrition level in your organizations so that you can work on it.
Here are a few major use cases which will help you understand how you can not just predict attrition but also understand the cause of attrition by using Darwinbox’s analytics module:
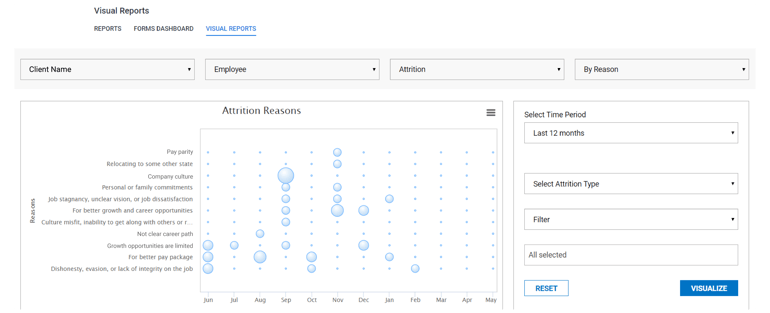
By Reason:
Darwinbox’s analytics feature makes you aware of the employee attrition rate based on the reasons for attrition. Once you figure out the highest reason for attrition, the next step is to work towards it. Not just that, you can apply a filter for the time period in which you want to get the data. You also have the benefit to find out the attrition rate based on location, business unit, department, grade, band, etc.
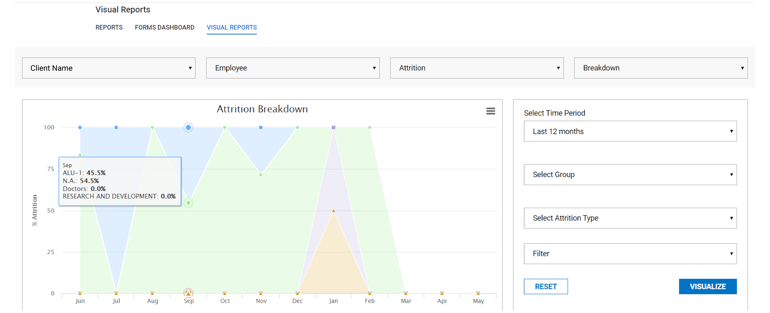
By Breakdown:
You can check the attrition rate by the breakdown at different levels of the business unit, department, grade, band, etc. According to the visual report setting, you can check the attrition types and apply a filter. (attrition breakdown based on department, BU, etc)
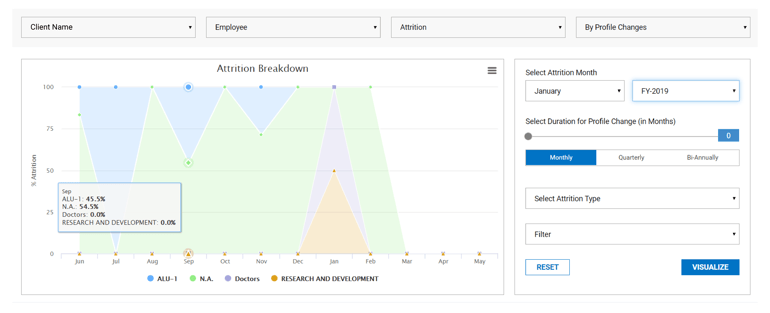
By Profile Changes:
Based on the continuous or unavoidable shift in the role of an employee there is a high chance of attrition. You can now check the data according to the time period and attrition type using Darwinbox’s analytics module.
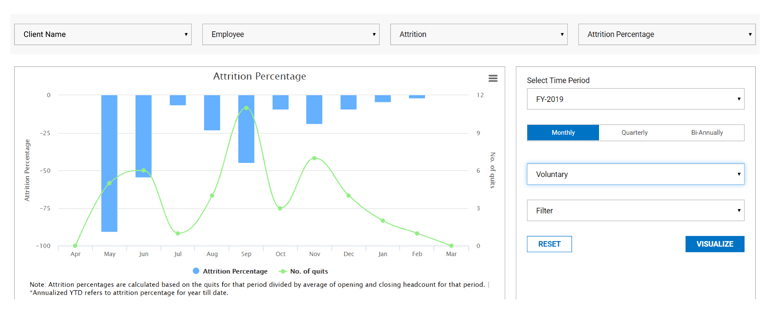
Attrition Percentage:
Now attrition percentage can be calculated easily. Based on the number of quits and the number of opening and closing headcounts for that specific period you can pull out the attrition percentage with respect to the time period.
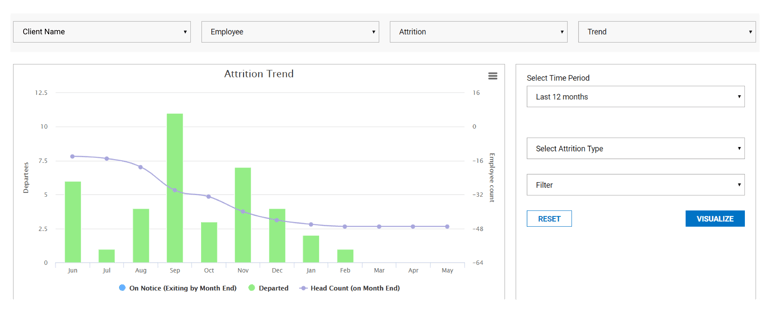
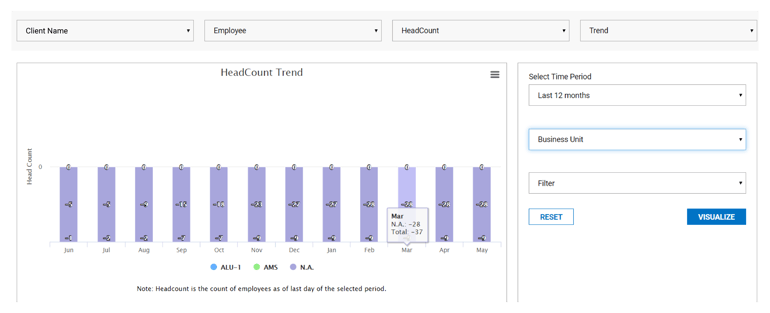
Trends:
Trend analytics can help you see clearly about what is working in your favor and what is not. You can find out the trend based on the time frame that you choose. This will help you in understanding the attrition trend based on the number of employees who are on notice, departed and headcount (on month end). You also have the autonomy to figure out the trends based on employee headcount.
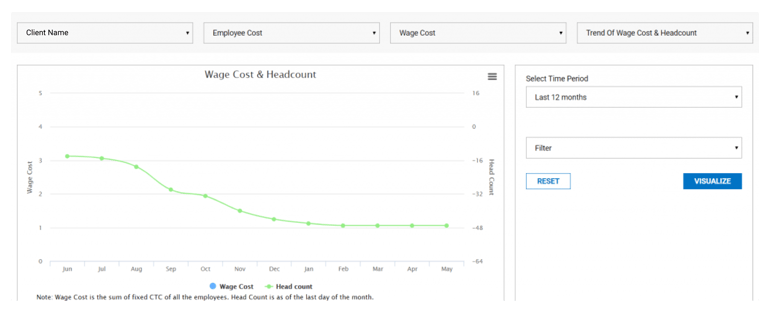
Trends Of Wage Cost & Headcount:
With the help of our analytics module, you can now figure out the trends of wage cost & headcount based on employee cost.
Darwinbox analytics module assists in not just taking preventive measures but also into making better hiring decisions. The proactive use of analytics will allow you to accurately anticipate, rather than react. Deriving trends of attrition out of past data is important in order to predict the future, as well as to board new employees. Employee data can be used to predict attrition, understand the reason behind it and thus take appropriate measures to prevent it.
Having said that, we have recently updated our analytics module extensively which now can slice through the core for any number of filters you would to check for. How you ask? Here are a few glimpses of the same -
New Analytics Dashboard:
-png.png)
With the new analytics dashboard, Darwinbox is providing a comprehensive and 360 degree slice through with the core module. With the help of the drop down filter, you have the ability to add filters to your analysis which may revolve around items like Hierarchy, Age Group, Grade, Contribution Level and much more. With this dynamic filtering option, make your search and analysis as specific as it could be!
Categorize Data which is directly linked to the CORE:
-png.png)
The flexibility to categorize data in based on the line items which slice through the core makes it a very powerful tool to base you analysis on a single property and arise to a particular understanding about the effect of that property on attrition.
Let's see an example of how the data seems when we consider the designation - -png.png) The data shows that the attrition rate for the company specifically for the employees with designations as HR Executive is 2.97% while the total attrition is 5.94% which means almost half of the attrition is in the designation HR Executive.
The data shows that the attrition rate for the company specifically for the employees with designations as HR Executive is 2.97% while the total attrition is 5.94% which means almost half of the attrition is in the designation HR Executive.
To understand and analyze more features on Darwinbox - Schedule a demo with us and we will take you through our product.

Speak Your Mind